
By Insurance & Estate Strategies | Independent Whole Life Insurance Advisory Team | Specialists in Cash Value Policy Design & Infinite Banking Implementation
📖 Estimated Reading Time: 14 minutes
TL;DR: The Bottom Line
A whole life insurance illustration is a multi-page projection showing how your policy is designed to perform over decades — premiums, cash value growth, death benefit, and dividends. The most important distinction is between guaranteed values (contractual minimums the company must deliver) and non-guaranteed values (projections based on current dividends that can change). How your premium is allocated matters more than total premium — in a policy designed for cash accumulation, 80%+ of premium should flow to paid-up additions, not the base policy. If your agent can’t explain every section of your illustration clearly, find one who can.
Why Trust This Guide
Our advisory team has designed and reviewed thousands of whole life illustrations across every major mutual insurance company. As independent advisors with access to all carriers, we design policies based on what’s best for the client — not a single company’s product line. This guide uses a real Penn Mutual illustration to show you exactly what to look for, what to question, and what most agents skip over.
Table of Contents
- Introduction: Why Illustrations Matter More Than You Think
- Anatomy of a Whole Life Illustration
- Key Components to Analyze
- Understanding Policy Design Features
- Reading the Ledger Pages
- Important Metrics and Numbers to Calculate
- Evaluating Illustrations Across Companies
- Practical Application: What to Do With Your Illustration
- Frequently Asked Questions
- Conclusion and Next Steps
Introduction: Why Illustrations Matter More Than You Think
A whole life insurance illustration is a detailed projection showing how your policy is designed to perform over your lifetime — premiums, cash value growth, death benefit, and dividends, laid out year by year through age 121.
Most people treat illustrations like car window stickers — they glance at the big number and move on. That’s a mistake. The illustration is where you discover whether a policy is designed for your benefit or for the agent’s commission. It’s where you find out whether your cash value will be accessible in year 3 or year 15. And it’s where properly structured policies separate themselves from expensive ones.
If you’re considering whole life insurance for permanent protection, cash value accumulation, or as the foundation for an infinite banking strategy, understanding how to read these illustrations isn’t optional — it’s the single most important skill you can develop before purchasing a policy.
This guide walks through a real Penn Mutual illustration to show you exactly what each section means, what the numbers are actually telling you, and what most agents never explain.
Anatomy of a Whole Life Insurance Illustration
Most illustrations from reputable whole life companies follow a similar structure. Here’s what you’ll encounter:
Cover Page and Basic Information
The first page includes the fundamentals:
- Insured’s information (name, age, gender, underwriting class)
- Policy type and name
- Initial premium amount
- Initial death benefit
- Agent and company information
- Date the illustration was prepared
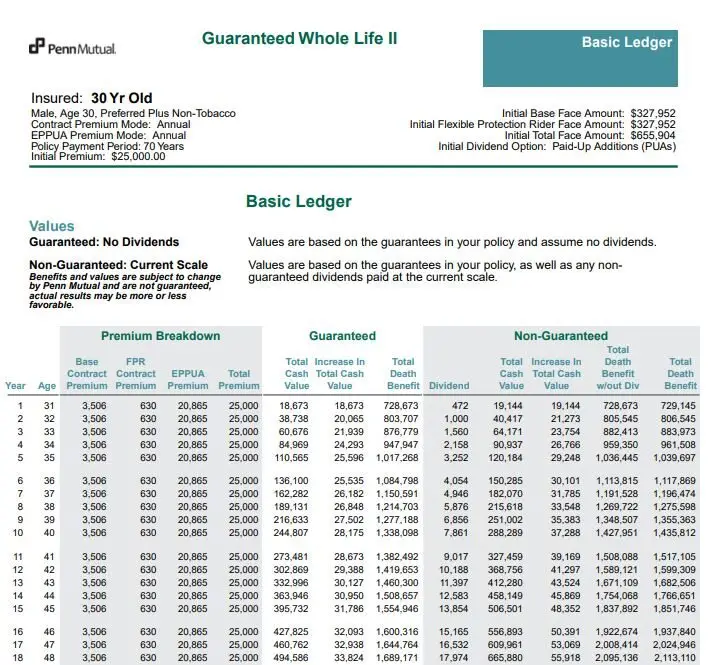
In our Penn Mutual example, this shows a 30-year-old male with Preferred Plus Non-Tobacco rating, an initial premium of $25,000, and a total face amount of $655,904.
Policy Overview Section
This section explains the base policy, included riders, premium payment structure, dividend options, how to access cash value, and tax considerations. Most people skip this and go straight to the numbers — don’t. This is where you learn how the policy actually works.
For instance, our Penn Mutual illustration explains how their Flexible Protection Rider blends term insurance with whole life to allow more premium directed toward cash value growth — a critical design element for infinite banking strategies.
Definitions Section
The glossary explains terms like cash value, paid-up additions, surrender value, cost indexes, and dividend scales. Reference this whenever you encounter unfamiliar terms — insurance terminology often means something different than you’d expect.
Ledger Pages (Basic and Supplemental)
The heart of the illustration. Year-by-year projections of policy values, typically spanning through age 121 (the policy endowment age). You’ll find a basic ledger showing guaranteed and current projections, plus supplemental ledgers showing alternative scenarios like reduced dividends or policy loan scenarios.
Signature Page
By signing, you confirm you’ve received and reviewed the complete illustration, understand that non-guaranteed elements can change, and recognize actual results may differ. Never sign an illustration you don’t fully understand.
Key Components to Analyze
Guaranteed vs. Non-Guaranteed Values
This is the single most important distinction in any whole life illustration.
- Guaranteed Values: The contractual minimum performance. The insurance company is legally bound to deliver these numbers regardless of their financial performance or economic conditions. This is your floor — the worst-case scenario.
- Non-Guaranteed Values: Projections that include dividends based on the company’s current dividend scale. These will fluctuate based on the insurer’s investment returns, mortality experience, and expenses.
Our Penn Mutual illustration shows three scenarios:
| Scenario | What It Assumes | Use It For |
|---|---|---|
| Guaranteed | Zero dividends ever paid | Worst-case baseline — the floor |
| Non-Guaranteed Mid-Point | Dividends at 50% of current scale | Conservative planning scenario |
| Non-Guaranteed Current | Dividends at full current scale, unchanged forever | Optimistic scenario — don’t plan on this |
The gap between guaranteed and non-guaranteed values widens dramatically over time, which shows how much dividends matter to long-term performance. A company’s dividend history tells you how realistic their current scale projections are.
Premium Breakdown (This Is Where Most People Get Lost)
This is the section that separates properly designed policies from expensive ones. Most people look at total premium and stop. What matters is where that premium goes.
In our Penn Mutual example, the $25,000 annual premium breaks down as:
| Component | Amount | % of Premium | What It Does |
|---|---|---|---|
| Base Contract Premium | $3,505.81 | 14% | Funds the core whole life policy and death benefit |
| Flexible Protection Rider (FPR) | $629.67 | 3% | Blends term coverage to boost death benefit while keeping costs low |
| Enhanced Permanent Paid-Up Additions (EPPUA) | $20,864.52 | 83% | Purchases additional paid-up insurance — maximizes early cash value |
| Why this matters: When 83% of premium flows to paid-up additions, the policy is designed for cash value accumulation. When the majority flows to base premium and death benefit, it’s designed for maximum protection. Neither is “wrong” — but your policy design should match your goals. If your agent designed an infinite banking policy with only 30-40% going to PUAs, the policy is not optimized for your stated objective. | |||
Key Takeaway — Premium Allocation
The premium breakdown reveals the policy’s true design intent. For overfunded policies designed for cash accumulation or banking strategies, you want to see the largest portion of premium directed toward paid-up additions — that’s what drives early cash value growth. If your illustration doesn’t clearly show this breakdown, ask your agent for it.
Cash Value Growth Projections
Cash value projections show how the policy’s internal savings component grows over time. Here’s what the Penn Mutual example shows at key milestones:
| Year | Total Premiums Paid | Cash Value (Non-Guaranteed Current) | Cash Value as % of Premiums |
|---|---|---|---|
| Year 1 | $25,000 | $19,144 | 76.6% |
| Year 5 | $125,000 | $120,184 | 96.1% |
| Year 10 | $250,000 | $288,000+ | 115%+ |
| Year 20 | $500,000 | $786,913 | 157.4% |
| What to look for: Year 1 efficiency above 70% is strong for an overfunded design. Break-even (where cash value exceeds total premiums) by year 5-7 signals a well-designed accumulation policy. Long-term growth above 150% of premiums by year 20 indicates healthy compounding. Compare these benchmarks against what your illustration shows — if year 1 efficiency is below 50%, ask your agent why. | |||
When analyzing cash value projections, pay attention to the break-even point (when cash value equals cumulative premiums), the year-over-year growth rate (it should accelerate over time as dividends compound), and whether the growth pattern is front-loaded or back-loaded. For a deeper look at how cash value builds at different ages and premium levels, see our whole life insurance cash value chart.
Death Benefit Projections
While cash value receives the most attention in accumulation-focused policies, the death benefit remains a crucial component. The illustration shows initial death benefit at issue, how the death benefit grows through dividends and paid-up additions, and the net amount at risk (death benefit minus cash value), which decreases over time.
Our Penn Mutual example shows an initial death benefit of $655,904 that grows to over $1 million by year 5 and exceeds $2.2 million by year 20 on non-guaranteed projections. This growth is one of the key advantages over term life insurance, where the death benefit is fixed and the policy eventually expires.
Understanding the relationship between cash value and death benefit at death is important — in most whole life policies, your beneficiaries receive the death benefit amount, not the death benefit plus cash value, unless the policy uses an increasing death benefit option.
Dividend Assumptions
For participating whole life insurance, dividends are the engine that drives non-guaranteed performance. Illustrations typically show projections based on the current dividend scale and an alternate (reduced) scale.
The Penn Mutual illustration includes both current scale projections and an alternate scale assuming an interest factor 0.25% less. This gives you a sense of how sensitive the policy is to dividend changes — if a 0.25% reduction dramatically changes long-term performance, the policy may be more dependent on optimistic assumptions than you’d like.
Before trusting any illustration’s dividend projections, check the company’s historic dividend performance. A company that has maintained or grown dividends through multiple economic cycles — including the low interest rate environment from 2008-2022 — gives you more confidence in current scale projections than one with a volatile history.
Understanding Policy Design Features
Base Policy Structure
The foundation of any whole life policy includes the type (traditional, limited-pay, or custom-designed), the premium payment period, and payment frequency.
Our Penn Mutual example is a “Guaranteed Whole Life II” with a 70-year payment period (to age 100). At age 70, the premium drops from $25,000 to just $4,135 because the EPPUA rider payments are structured to end after 24 years while the base policy continues.
Riders and Their Impact
Riders modify the base policy’s behavior. The Penn Mutual illustration includes:
- Flexible Protection Rider (FPR): Blends term insurance with whole life to increase death benefit while directing more premium toward cash value — essential for accumulation-focused design
- Enhanced Permanent Paid-Up Additions Rider (EPPUA): Allows additional premium to purchase paid-up additional insurance, dramatically accelerating cash value growth
- Accelerated Death Benefit Rider: Access to a portion of death benefit if diagnosed with terminal illness
- Chronic Illness Accelerated Benefit Rider: Access to death benefit for qualifying chronic illness — functions as a living benefit without the cost of standalone long-term care insurance
- Overloan Protection Benefit Rider: Prevents policy lapse from excessive loans — particularly important for infinite banking strategies that rely heavily on policy loans
Each rider serves a specific purpose and affects performance differently. Understanding these effects is critical for evaluating whether the policy is designed for your objectives.
How Policy Design Affects Results
Different designs produce dramatically different outcomes:
- Maximum Death Benefit: Higher base premiums, less emphasis on paid-up additions — prioritizes protection
- Balanced Growth: Moderate base premium blended with paid-up additions — balances protection and accumulation
- Maximum Cash Value: Minimized base premium, maximized paid-up additions — prioritizes accumulation for infinite banking or wealth-building strategies
Our Penn Mutual example is heavily weighted toward cash accumulation with 83% of premium directed to EPPUA. This is the design you’d expect for infinite banking or maximum cash value strategies.
Policy Payment Period Considerations
Payment period affects both affordability and performance:
- Continuous Premium (Pay to 100): Lower annual premiums but longer commitment
- Limited Pay (10-Pay, 20-Pay): Higher annual premiums but the policy is paid up sooner, meaning no further premiums required
There is no universally “best” design. The right structure depends on whether you prioritize death benefit, cash value growth, premium flexibility, or some balance. What matters is that the design matches your stated goal.
Reading the Ledger Pages
The ledger section is the densest part of the illustration — year-by-year data spanning decades. Here’s how to navigate it without getting lost.
What the Columns Mean
Most ledgers include columns for policy year and insured’s age, annual premium outlay, annual dividend (non-guaranteed), guaranteed cash surrender value, non-guaranteed cash surrender value (current scale), guaranteed death benefit, and non-guaranteed death benefit (current scale).
Some companies also include columns for accumulated premiums paid, internal rate of return, and net amount at risk.
Where to Focus
You don’t need to analyze all 90+ rows. Focus on these milestone years:
- Year 1: What’s your immediate cash value efficiency? (Target: 70%+ for accumulation designs)
- Year 5: Are you approaching break-even? (Cash value near or exceeding total premiums paid)
- Year 10: How is compounding developing? Cash value should be meaningfully ahead of premiums
- Year 20: Long-term growth trajectory — where does the policy stand relative to premiums?
- Age 65: If you plan retirement income through policy loans or withdrawals, what’s available?
- Age 80-90: Death benefit at this stage — this is what your beneficiaries actually receive
Supplemental Ledgers
Many illustrations include supplemental ledgers showing alternative scenarios. Pay special attention to the reduced dividend scenario — this shows what happens if dividends drop. If policy performance collapses under modest dividend reduction, the design may be too aggressive. Also look for loan scenario ledgers if you plan to use the policy for banking. These show cash value, loan balance, and net death benefit after years of policy loans, which is essential for understanding how loan recognition works.
Important Metrics and Numbers to Calculate
Beyond the raw data in the ledger, these calculations help you evaluate and compare policies:
Internal Rate of Return (IRR)
IRR tells you the effective annual return on your premium dollars. Calculate it at multiple points — year 10, 20, and 30 — for both cash value and death benefit. A properly designed accumulation policy from a top-rated company should show cash value IRR of 3-5% by year 20 on the non-guaranteed side, and death benefit IRR that’s substantially higher due to leverage.
Cash Value Efficiency Ratio
Divide accessible cash value by total premiums paid at each milestone year. Year 1 efficiency of 70-80% is strong for accumulation designs. Below 50% in year 1 often signals too much premium going to base policy or death benefit costs.
Premium-to-Death-Benefit Leverage
Your initial death benefit divided by your annual premium tells you the leverage ratio. In our Penn Mutual example: $655,904 / $25,000 = 26.2x leverage. This means from day one, your $25,000 premium provides over $655,000 in death benefit protection — a multiple that no pure investment can replicate.
Net Cost Index and Surrender Cost Index
These standardized metrics (required in most states) let you compare cost efficiency across companies on an apples-to-apples basis. Lower is better. You’ll find them near the end of most illustrations.
Key Takeaway — Metrics
No single number tells the whole story. IRR shows growth efficiency, leverage ratio shows protection value, and cost indexes show relative expense. The best evaluation combines all three with an understanding of guaranteed vs. non-guaranteed performance. If your agent only highlights non-guaranteed current scale projections, ask to see the guaranteed IRR — that’s the number they can’t talk their way around.
Evaluating Illustrations Across Companies
When comparing illustrations from different whole life insurance companies, ensure you’re comparing apples to apples:
Match the design. Same premium, similar death benefit, same payment period, same rider structure. A $25,000 premium with 83% to PUAs will look very different from a $25,000 premium with 40% to PUAs — that’s not a company comparison, it’s a design comparison.
Compare guaranteed values first. Since non-guaranteed projections are based on each company’s current dividend assumptions (which vary), guaranteed values show which company offers a stronger contractual foundation.
Check financial strength ratings. An illustration is only as reliable as the company behind it. Look for A+ or higher ratings from AM Best, and verify the company is a mutual (owned by policyholders) or has a strong dividend-paying track record.
Examine dividend history, not just current scale. A company illustrating at 6.5% current scale with a history of maintaining that rate for 20+ years is more credible than a company illustrating at 7% with a history of cuts. Our dividend rate history page tracks this across major carriers.
Look at cost indexes. Net surrender cost index and net payment cost index are standardized for comparison. Lower indexes mean better cost efficiency.
Consider company-specific riders. Some companies offer riders that others don’t — like Penn Mutual’s Flexible Protection Rider or MassMutual’s paid-up additions structure. Rider availability can meaningfully impact policy performance for specific strategies.
Practical Application: What to Do With Your Illustration
Before You Buy: The Pre-Purchase Checklist
- Verify all personal information is correct (age, gender, health class) — errors here change everything
- Confirm premium allocation matches your goals (accumulation vs. protection)
- Review guaranteed values independently of non-guaranteed projections
- Check the MEC status — if the policy is a Modified Endowment Contract, tax treatment changes significantly
- Ask for multiple illustrations: different premium levels, different companies, different rider configurations
- Request a reduced dividend scenario to see policy sensitivity
After You Buy: Ongoing Monitoring
- Request an in-force illustration annually — this shows actual performance against original projections
- Compare actual dividends received to what was illustrated
- Track your cash value growth against the milestones in your original illustration
- If the company changes its dividend scale, request an updated illustration to see the impact
- Review whether your policy still aligns with your goals as your financial situation evolves
Questions to Ask Your Agent
- “How conservative are the dividend assumptions in this illustration compared to this company’s actual history?”
- “What would happen to this policy if dividends were reduced by 1%?”
- “Why did you allocate the premium this way? What would change if we shifted more to PUAs or to the base?”
- “How does this design compare to what you’d recommend from [other company]?”
- “What is the reduced paid-up value if I need to stop paying premiums in year 10?”
- “How have your other clients’ policies performed relative to their original illustrations?”
Beyond the Basics
If you’re studying whole life illustrations because you’re considering infinite banking or Volume-Based Banking, the illustration is just the starting point. Policy design determines whether your banking system works efficiently or bleeds cash to unnecessary insurance costs. Our Ultimate Asset guide explains how properly designed whole life insurance becomes the foundation for a fundamentally different approach to building wealth.
Conclusion and Next Steps
A whole life insurance illustration is the most important document you’ll review before purchasing a policy. By understanding guaranteed vs. non-guaranteed values, premium allocation, cash value milestones, and how to calculate key metrics like IRR and efficiency ratios, you can evaluate whether a policy is designed for your benefit — not the agent’s commission.
The key principles:
- Guaranteed values are your floor — if they don’t work, the policy doesn’t work
- Premium allocation reveals true design intent — where the money goes matters more than how much
- Dividends drive long-term performance but aren’t guaranteed — plan on the midpoint, not the current scale
- Compare apples to apples — same design, same premium, same payment period across companies
- Monitor annually with in-force illustrations — your policy is a living financial tool, not a static purchase
Get Your Personalized Whole Life Illustration Reviewed
Whether you’re comparing illustrations for a new policy or want a second opinion on one you’ve already received, our Pro Client Guides will walk you through every section and show you what the numbers actually mean for your goals.
- Illustration Review: Line-by-line analysis of your current or proposed illustration
- Design Comparison: Side-by-side comparison across top mutual companies — same premium, same design
- Optimization Check: Is premium allocation maximized for your stated goal (accumulation, protection, or banking)?
- Honest Assessment: Whether whole life is right for your situation — sometimes term insurance really is the better answer
- No Obligation: Complimentary session with zero pressure to purchase
Schedule Your Free Illustration Review →
One illustration reviewed by a specialist is worth more than ten you try to decode alone.
Frequently Asked Questions
How much cash value does whole life insurance have in year 1?
It depends entirely on policy design. In a properly structured accumulation policy like our Penn Mutual example, year 1 cash value was $19,144 on a $25,000 premium — roughly 76.6% efficiency. Policies designed for maximum death benefit may show 30-50% first-year efficiency. If your illustration shows less than 50% in year 1 and you’re buying for cash accumulation, the design may not be optimized for your goal.
Are whole life insurance illustrations guaranteed?
Only the “guaranteed” column is contractually binding. Everything in the “non-guaranteed” or “current scale” columns is a projection based on assumptions that can change. The guaranteed values represent the worst-case scenario — what the company must deliver even if dividends drop to zero. Always evaluate your policy on guaranteed values first.
What’s the difference between guaranteed and non-guaranteed values?
Guaranteed values are contractual minimums the insurer must deliver regardless of economic conditions — effectively what happens with zero dividends. Non-guaranteed values include dividend projections based on current assumptions and can be higher or lower than illustrated depending on the company’s future performance.
How do I compare whole life illustrations from different companies?
Match the design first: same premium, similar death benefit, same payment period, same rider structure. Then compare guaranteed values (the contractual floor), non-guaranteed values at both current and reduced scales, cost indexes, the company’s dividend history, and financial strength ratings. An independent advisor with access to multiple carriers can run these comparisons for you.
What is a good cash value growth rate for whole life insurance?
A properly designed accumulation policy from a top-rated mutual company typically shows internal rates of return of 3-5% on cash value by year 20 on the non-guaranteed side. Because this growth is tax-deferred and accessible tax-free through policy loans, an effective 4% whole life return can be equivalent to 5.5-6.5% in a taxable account depending on your tax bracket.
Why is the premium breakdown important in a whole life illustration?
Premium breakdown reveals whether the policy is designed for your goals. In a cash accumulation policy, 70-85% of premium should flow to paid-up additions — that’s what drives early cash value. If the majority goes to base premium and death benefit, the policy is designed for protection, not accumulation. Misaligned design is the most common reason people are disappointed with whole life performance.
How often should I review my whole life insurance illustration?
Request an in-force illustration annually and after any significant change in the company’s dividend scale. This lets you compare actual performance against original projections, catch any issues early, and adjust your strategy if needed. Policyholders have the right to request an in-force illustration once per year, and the company must provide it within 30 days.
What does it mean if my agent can’t explain every section of the illustration?
Find a different agent. A whole life illustration is a complex document, and the person recommending you commit tens of thousands of dollars annually should be able to explain every section clearly — premium allocation, guaranteed vs non-guaranteed values, rider impact, dividend assumptions, and ledger data. If they redirect you to “just look at the summary,” they either don’t understand the product or don’t want you to.


2 comments
Vina Sledge
Thank you for providing the vital information to educate people on how whole life insurance is designed to help meet the financial needs and goals.
Insurance&Estates
Thank you – I really appreciate that. Glad the information is helpful!